
what now?
market vibes

November 6 … )
In the markets
The easy trades are bitcoin higher and oil lower. Both markets have been moving horizontally for months with developing narratives and uncertainty. This morning prices are poised to validate the strong side of the auction in long and short time framess. However, there is no urgency to act unless you are losing money.
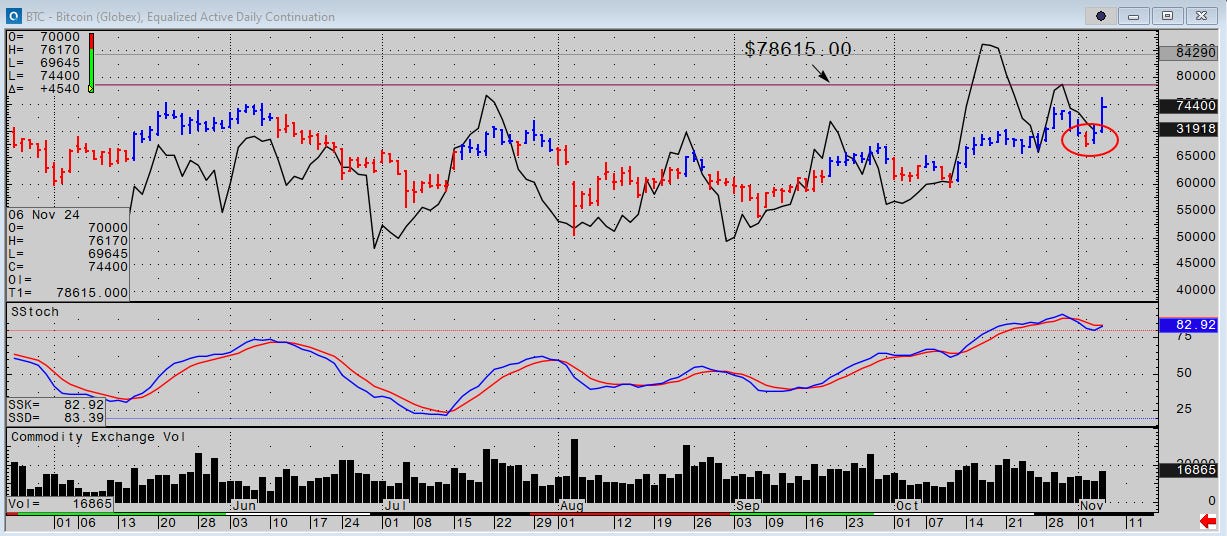
BBG this morning: “The largest digital asset rose as much as 9% to $75,372 as early results showed Trump barreling towards a win.”
CME November BTC Chart below) has yet to make an ATH but spot XBT made a new high earlier this morning. Futures have a mixed technical set up that can easily align with a bullish trend. I like the DMI 1 bar up false positive (single red down bar rejected yesterday). Open interest looks stable 1 % from an ATH and steady futures volume has nothing to prove. If BTC doesn’t make new highs in futures today it’s a small omission, imo.
Oil
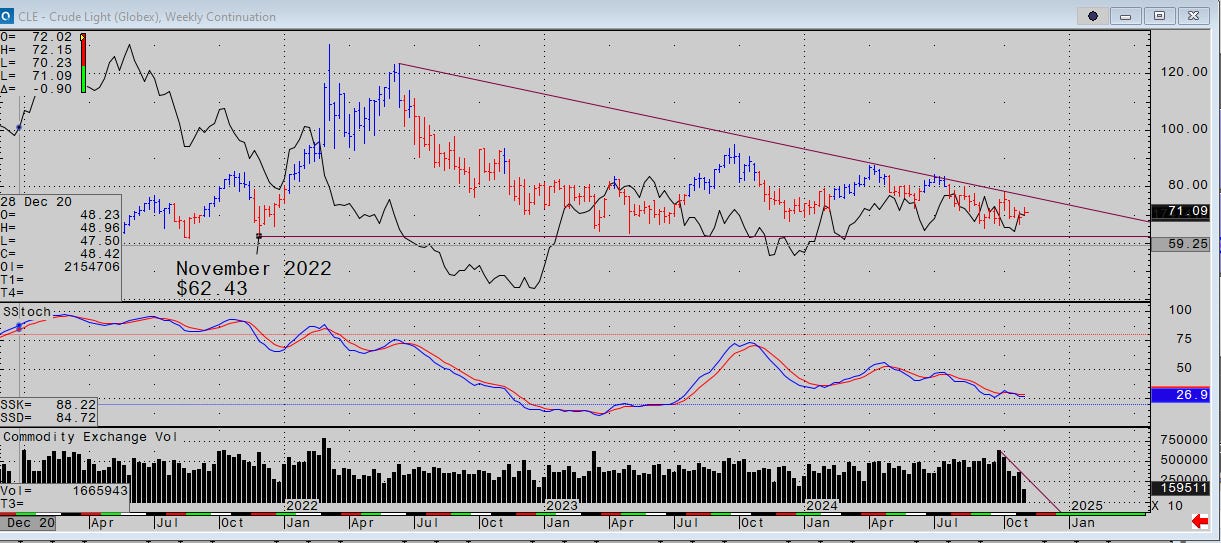
I’ve posted this down wedge in weekly data in WTI many times. The very long-time frame auction implies sellers are becoming more and more competitive lowering their offers as long-time frame buyers consistently enter the market in the low to mid $60s where they see long time frame value.
This “auction” usually goes on until the accumulating offers of the sellers converges with the buyers below the market and all the bids are filled. Then the excess of unsold oil drives lower in search of new buyers at an unknown level.
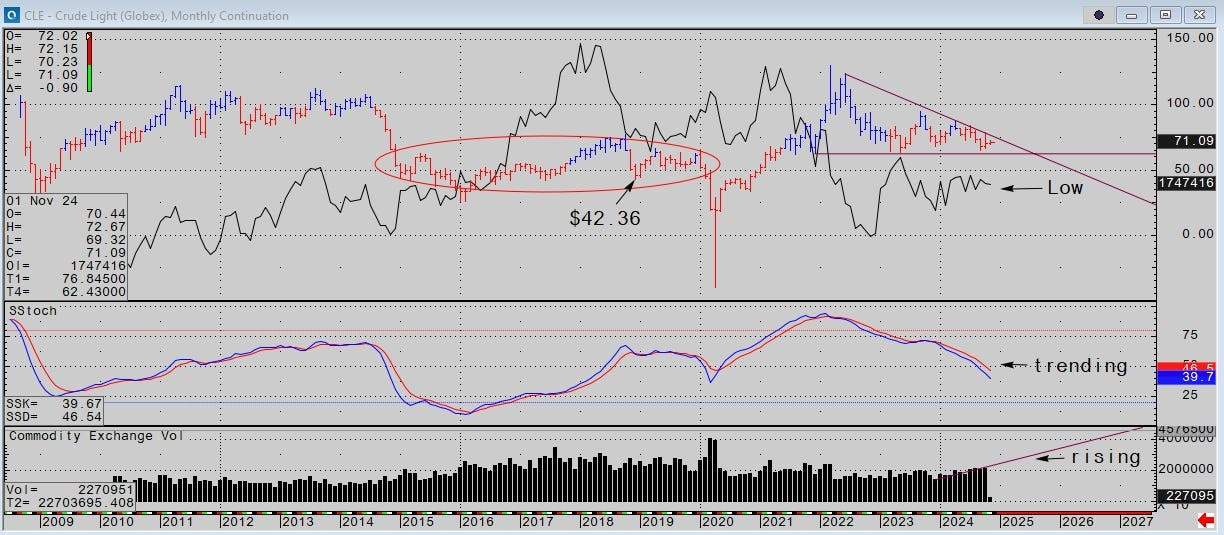
Here’s a monthly chart with some easy assumption if prices violate long term support ca $62.00. Oil likes ranges and its nature is to seek levels where the industry can price, refine and hold inventories with confidence quickly. Once it does, it tends to stay there. It was $100 for 4 years, dropped to a $40 to $50 range for 6 years and oil has been $70 to $80 per barrel since 2022.
Fwiw oil did not want to trade $100 or $90 or $85 recently. Various factions forced it to trade above its neutral level for a long time and that imbalance may cause some type of excess capitulation if and when it breaks $60. My best guess is it trades under $50 briefly and reverts towards the mid $50 for a few years.
In the stock market
BBG 14:00 yesterday: NVidia overtakes Apple to reclaim spot as world’s largest stock, Bank of America reminds us that we are out of our minds.
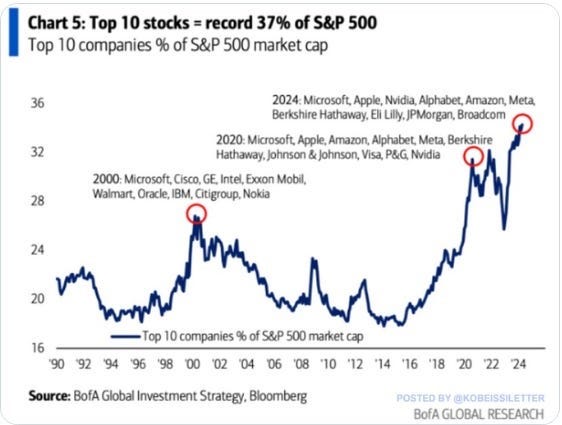
The rally this morning is bizarre. Longer time frame technicals ust get worse. Concentration of risk continues its financial black hole implosion. breadth can often be expressed with the activity of one or two stocks.
Trump’s oath to voters is to break up the very companies that buyers are ramping higher today is going to come home to its political roost. Banks are not his besties. Yellen is gone. I don’t know about Powell. His .50 cut in Sept had an awfully funky sniff. Buffett’s cash is 325 billion and he’s not buying stocks here. Bezos is selling.
If you’re long God Bless your gutsy conviction!

In other markets
Copper is sharply lower, the Yen is sharply lower, The BCOM gapped lower but the range seems contained.
The BCOM chart does look dangerous if the day’s range extends lower and making new lows for the week, month and quarter. if I were an AUM commodity long, I’d at least set a walk-away money stop. (next chart)
