
negative development in oil, positive in silver,
market vibes

May 7…)
“It isn't the mountains charts ahead to climb that wear you out; it's the pebble in your shoe.” Muhammad Ali
in the news
US crude oil inventories fell 2.3 million barrels to 457.2 million barrels during the week ending May 1, according to DOE data yesterday. US commercial inventories are 1% above the five-year average for this time of year.
Gasoline stocks fell a seasonally normal 2.5 million barrels. The most recent figures showed that average daily gasoline production decreased to 9.6 million barrels. For middle distillates, inventories decreased by 1.3 million barrels, with production decreasing to an average of 4.9 million barrels daily. Distillate inventories are still 11% below the five-year average.
These are interesting product data because gasoline and distillate production was down a lot at a time when refinery margins are at record highs. Product inventory is below 5-year averages (a subtle enforcement of a shortage narrative) because America is exporting record amounts of petroleum fluids. If you own oil equities this is a good thing. Unlike Jeff Currie’s “hair on fire” forecast for empty tanks by the 4th of July, refineries are making more money than ever.
The drop in output last week was actually tiny. Crude runs were only down 42,000 bpd to 16.0 million bpd (which is robust), and utilization went up from 89.6% to 90.1% (95% is the red line). The reality is refineries are running hot and this drop in product output is just tapping the brakes, imo. From my perspective… DOE data confirms the American oil business is in supremely fine form.
Moreover… the four-week average of products supplied (demand) was 20.3 million bpd. Demand is what we consume. You can’t buy more demand and store it in a tank. Inventories are what we have. You can buy more oil anytime you want. Just reach for the mouse and click. The four-week average of products supplied (proxy for demand) has not changed +/- 2 mm bpd in over 20 years. Let that sink in.
in the markets
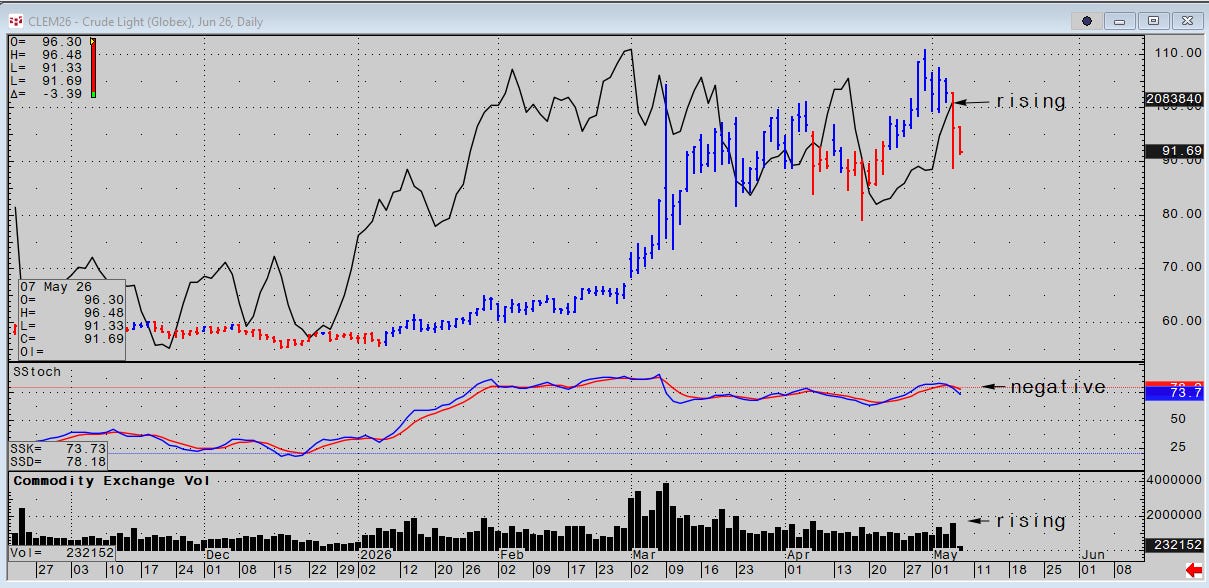
Open interest in WTI futures continues to rise on rising volume and negative technical development. Directional movement is negative. %D in the 45-period slow-stoch will confirm a downtrend if price settles at or below 91.50 basis June today.
The increase in OI indicates willing sellers offering liquidity to spec buyers. Systemic CTAs don’t care about the back-and-forth dynamics of war and peace. Insiders have been active both front-running and rising long and short positioning, imo.
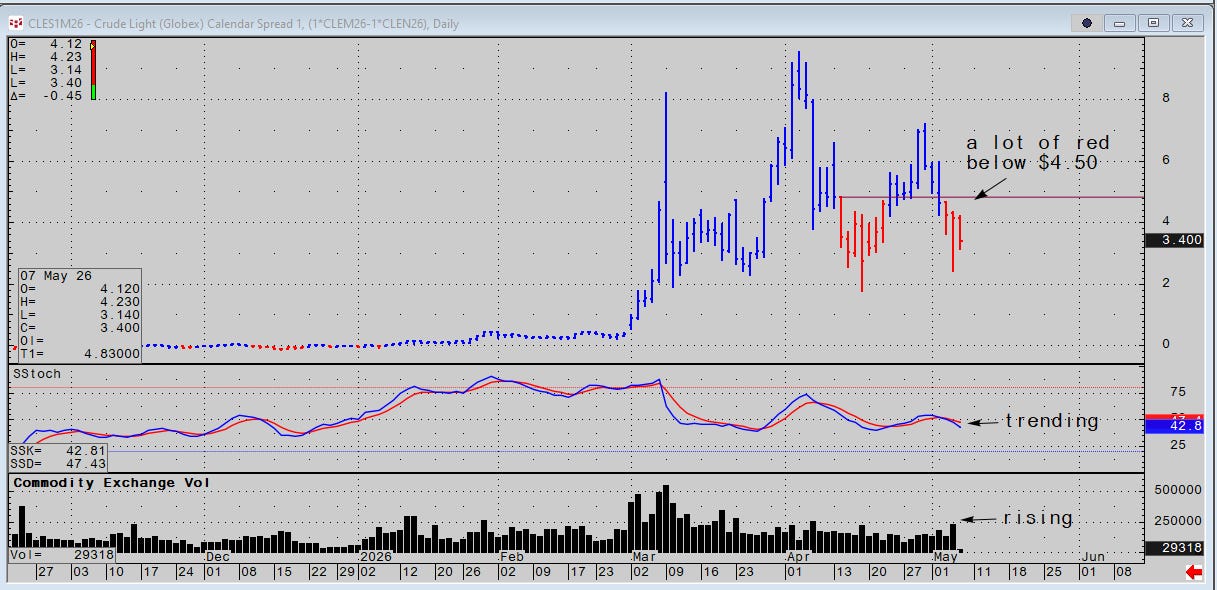
The June/July front spread is weakening on rising volume (next chart). In the absence of hard news, the Iranian visit to Beijing concurrent with an easing in market behavior implies China may want this conflict to end.
The most important part of the Chinese factor is not the absolute quantity of their reserves. It is whether China continues to add to them at the current furious rate. Downstream consumer demand is unchanged in America (the largest consumer in the world). Foreign demand in Asia and Europe is falling like a rock.
“Demand” is China’s demand for crude. If China buys fewer barrels… there it is.
Positive technical development in gold is trading the same “peace” narrative. More on gold in the vibe.
