"...four degrees before tap dead center."
market vibes
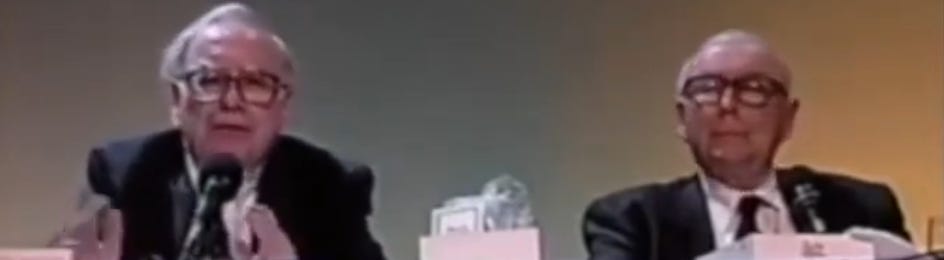
“Well, I think this whole episode is going to have about as about much of an impact on Berkshire Hathaway’s future as Warren’s bridge playing.”
May 10…)
Early in the morning of May 6 I posted this on X.
Dow Eminis deserve an honorable mention for performance yesterday, but silver gets top honors for pro-trend technical development. USD/XAG rose 3.5% and closed on the highs while making new highs for the week and month. In most instances of fractal range extension in multiple time samples, especially monthly data, money is moving with the major trend.
July silver cob Thursday May 9.
Now we know quite a bit more than we did on May 6. The correction has run its course in futures. Fifteen thousand lots of weak length is out, 15k lots of shorts have covered and the weak side of positioning was forced to pay up yesterday. The reason why the SHFE went from hot to cold abruptly in mid-April is not relevant. However, we can say with a degree of confidence that longs with bad location who bled out on declining volume these past 4 weeks are gone. SHFE specs were buyers last night.
As for positioning in longer time frames, open interest is now 70k lots lower than it was at the same prices in Feb 2020 (350 mm toz), 50k lots lower than it was in August 2020, and 40k lots lower than it was in June 2021. In a normal market, open interest provides elasticity when metal is tight so supply can flow through the system in an orderly way. One would think that is the case now. Maybe.
Allow me to refer you to the silver institute’s 2024 supply demand report indicating a cumulative 5-year deficit => 1 billion toz including a projected 265 mm toz deficit in 2024. When there is a structural shortage in the system and specs acquire excess exchange OI representing the aforesaid systemic slack…sht happens. https://www.silverinstitute.org/silver-supply-demand/
(Silver in weekly data illustrating the OI data noted above). Remember this when you listen to Buffett and Munger in the clip below.
Next below is a 50-year chart in monthly data. I’ve isolated periodic range compression preceding silver’s two episodic rallies. There is no symmetry to them other than a violent history of rinse-repeat 31 years apart. Silver has been ‘rinsing’ for 13 years and it’s possible we are approaching the next repeat, imo. Maybe now, maybe next month. We failed at 30 three times and we’re back again.
At the bottom right in the lower box an Average Directional Index reads 7.06 touched in early January 2024. ADX is a wonky tool with a simple thesis that measures price compression and kinetic release, strong to weak and vice versa. It does not indicate direction. The information imparted here is that range compression in January 2024 was the most intense in the history of CQG’s data library going back to 1974.
I wrote about it in January but it’s not the kind of observation that has timely or tradable meaning in the moment. When you’re writing about lots of markets every day something like this, although profound from a high level, washes out with the evening tide.
In my opinion.. it is likely considering the amount of risk premia sold everywhere every day across the board and the subsequent compression that attracts complacent grantors of long dated 10 delta high vol OTM options over the course of years… someone… perhaps several major players, are short a scary amount of gamma in the $30s. No evidence on that, I just think so.
My vibe
Silver is a unique commodity. It is gold with no official buffers, no CBs to step in when things go parabolic. No official stock to draw on. Silver possesses the same emotional fury as gold, the same ancient monetary DNA, but gold has a market cap of $15 trillion and immense official reserves in a crisis. The combined total of all silver on both sides of the pond is probably worth <$50 billion. I refer you to the Silver institute 2024 data above once more. We are in a 5 year period of chronic supply deficits. If there are any reserves available, they are not here. https://www.silverinstitute.org/silver-supply-demand/
Warren Buffett bought 3500 tonnes of spot silver from July 1997 to February 1998 starting around $4/toz up to $8 or $9 dollars. March/May traded $5 dollars in backwardation but “traded” is an inadequate word. Terrified is closer in spirit. He didn’t know 130 million toz was literally the entire marginal excess of silver globally.
Finally, Bob Rubin called him and asked him to stop buying, please. Of course he stopped; $1 billion was small beer for BRK. The same scale today is $5.4 billion… still small beer. He kept it for 8 years and sold it for $13 in April 2006.
Listen to his thesis…
PS… Silver is easy to trade when it’s calm like now. It is insanely dangerous when the other silver, the one that can move 7 dollars in a single sssion… or 16 dollars from a Thursday morning to a Monday opening (September 22 to September 26, 2011), comes to visit.
**always a taker of ideas and views**
Good luck today.
JJ
Follow me on X @Alyosha745
Charts and data CQG and Bloomberg
Metals, oil and everything else is not a registered investment advisor, and comments are for informational use only. Any mention of a particular security, index, derivative, or other instrument is NOT a recommendation to buy, sell, or hold that security, index, derivative, or any other instrument. Metals, oil and everything else makes no representations as to the accuracy of data or any attributions.


Silver - don't forget that Bill Gates joined him at the time...also for silver, call it what you want - "delta hedging" "gamma" "face ripped off" but the options markets are wagging the dog and we're still in spike territory...
love your posts ! it's becoming part of my routine, thanks for the insights