
friday wrap, july 24
market vibes

Take a second and study this chart.
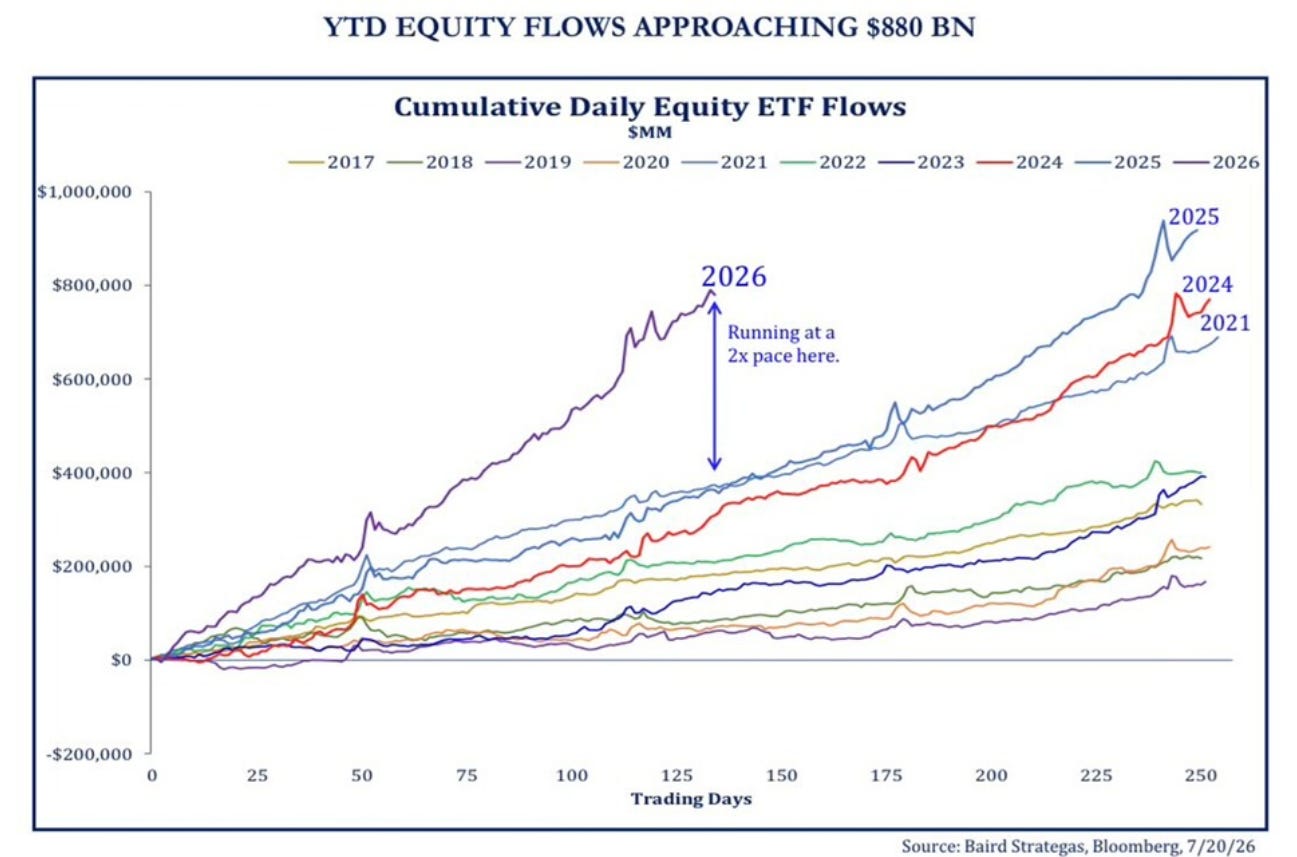
More money came into the stock market in Q-1 2026 than ever in history. More money came into the stock market in Q-2 than ever in history. Imagine where stock prices would be if flows were not 100% greater than last year.
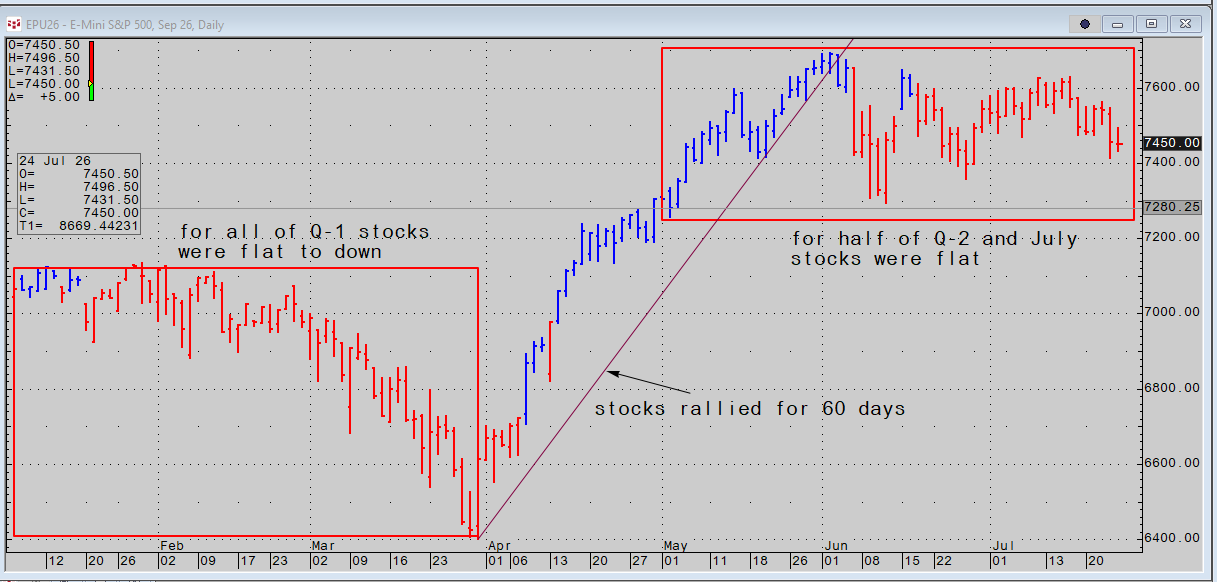
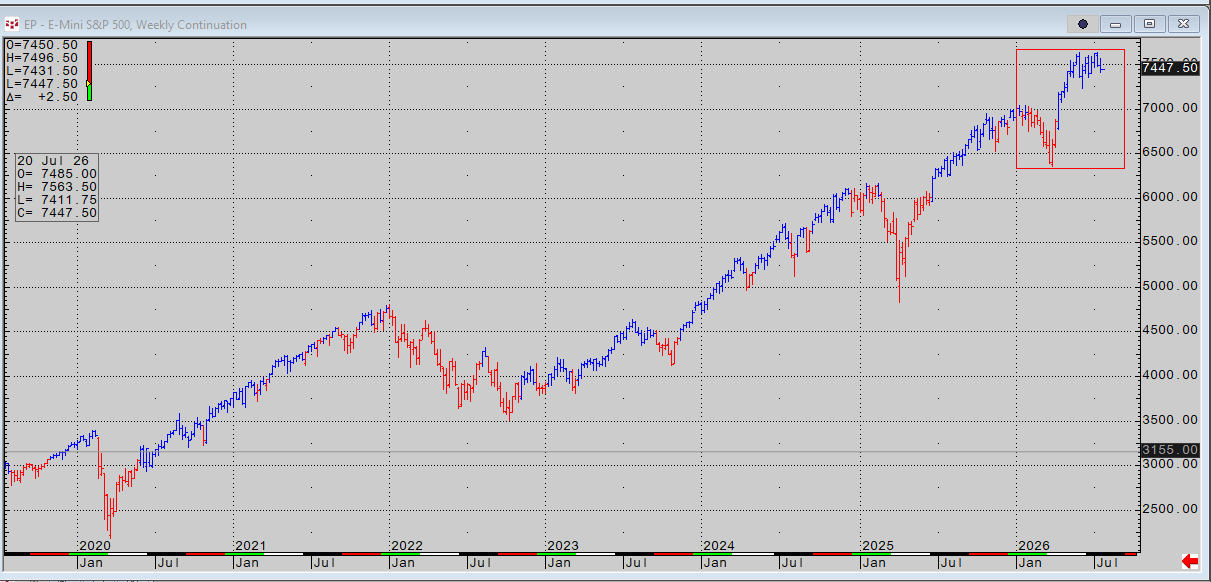
If equity flows maintain this rate $1.8 trillion dollars of new buyers will have location greater than S&P 7000. Margin debt is 53% higher year over year so it follows that $440 billion of the $880 billion was borrowed money. Plus, a $trillion doesn’t buy a lot of equities at S&P 7000.
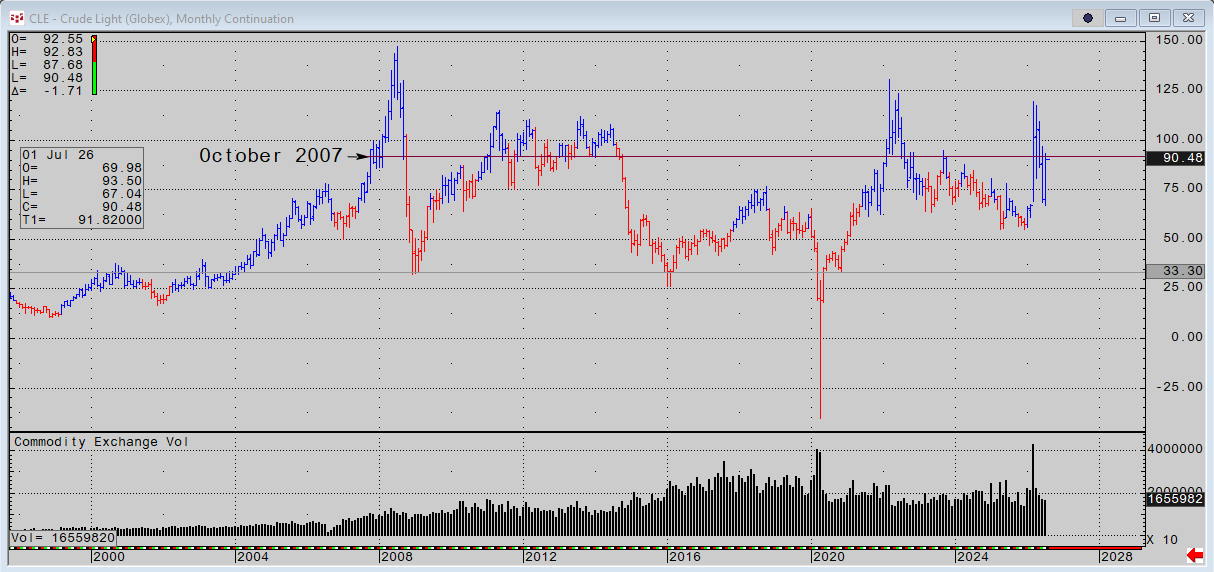
In October 2007 WTI traded $90/barrel for the 1st time in history. It traded $90/barrel for another 5 months and rallied to $147.00 in July 2008. WTI traded $90 or higher from December 2010 to October 2014, 3 years and 10 months. WTI traded $90/barrel for roughly 20 months after the War in Ukraine started and it has traded $90 for 5 months in 2026. Stated another way in a 228 month sample WTI has traded $90/barrel one in every three days.
Does it seem odd that the entire world, every politician, every analyst, every market and Central bank has been obsessed about the price of oil at a time when the inflation adjusted (we obsess about inflation) value of crude is roughly half what it was in 2007 when it first traded $90/barrel? We all know it. The question is why do we do it?
Unfolding this evening is a discussion of things we never look at that have no correlations or rhymes or reasons but dominate many of the riddles in trading we can’t explain.
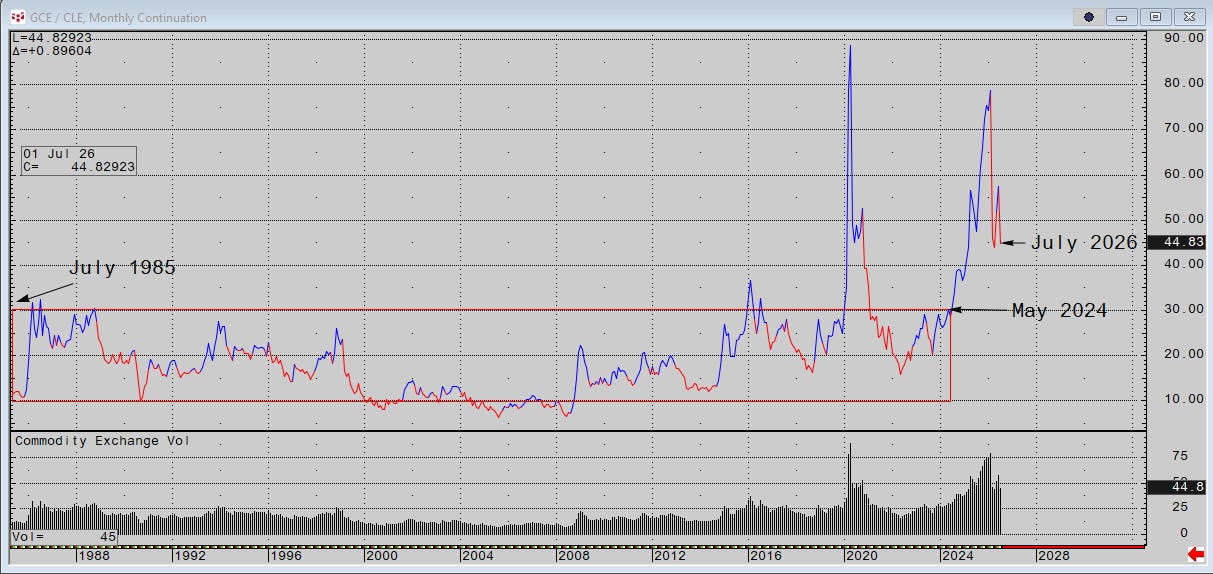
The gold/crude ratio has been between 10 barrels to the ounce and 30 barrels to the ounce 92% of the time since 1985. From the spike high during covid to low in June 2023, the ratio took 25 months to revert to its mean. I see deflationary forces looming even now and accelerating in 2027 so I am leaning toward oil going lower.
In order for gold and oil to revert to a ratio of 30 oil must stay at or below $100 and gold must drop to $3000, a probable scenario. However if oil were to drop to 50, gold would need to trade $1500. Think for minute what other prices might be doing if oil were to stabilize and remain at $50 (it stayed at $100 for nearly 4 years 15 years ago)… use your imagination.
On the other hand with a war in the middle east and many eager to see it ignite… oil could go to $200 and gold to $6000. In Ratio analysis the pairs can do anything. The point here is the hidden power of long term behaviors that are not aligned by politics, finance or wars. They are existential. This is worth keeping in mind as the ratio moves back towards 30 barrels to the ounce and perhaps even 10 barrels to the ounce, which history implies it will do.
There is no better example of the ignorance of relative values to one another than the gold silver ratio. These two precious metals are historically and culturally joined at the hip but the history of their highs and lows is not.
