
evening wrap, june 25
market vibes

“Nothing strengthens authority so much as silence.” Leonardo da Vinci
Apropos to the silence of the session in New York today, Powell testified before the Senate, and in the lists of top news on Bloomberg, there isn’t a single line about what he said. Housing data was expected to be soft but came in twice as bad as estimates at -13.7%. .
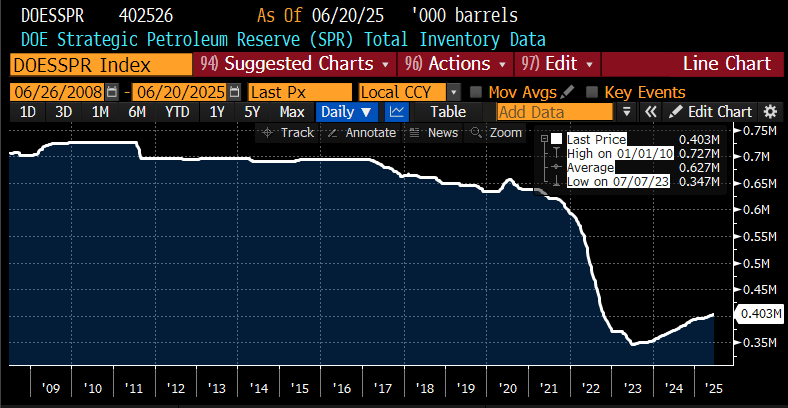
DOE data was mildly bullish with a net draw of 7 million barrels of all fluids, most of it crude oil in PADD 3. Other metrics were so normal, I wouldn’t know there was a war from looking at industry data. The SPR continues to creep higher, up 50 million barrels in 2 years. At this rate, we’ll get back to 2020 levels in 10 years.
In the markets
Silver has had every possible opportunity to go down for an entire month, and it didn’t.
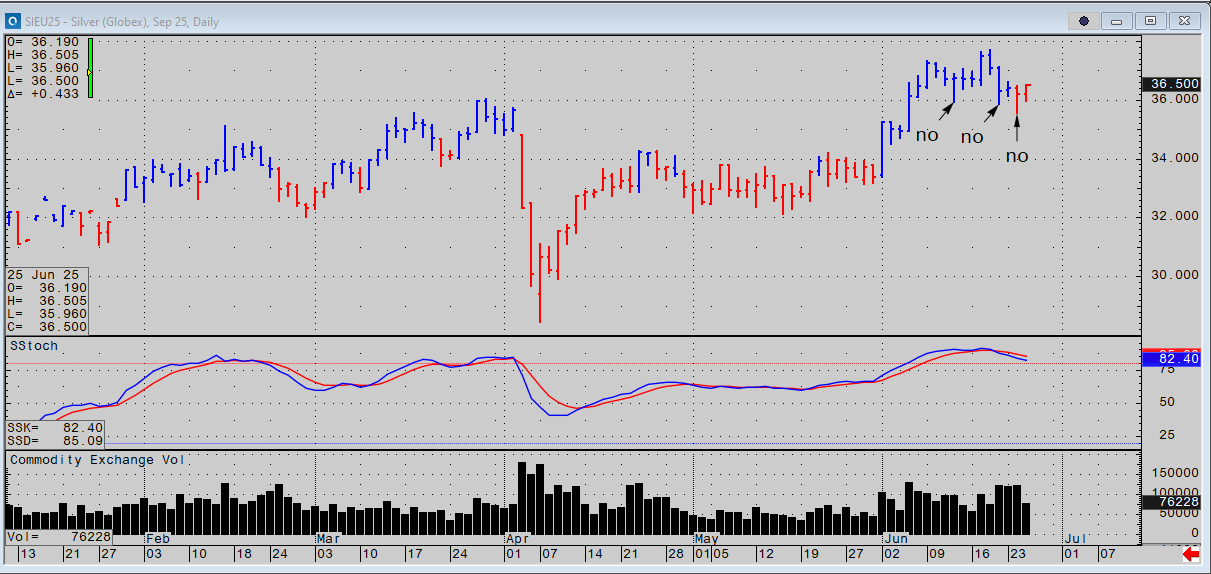
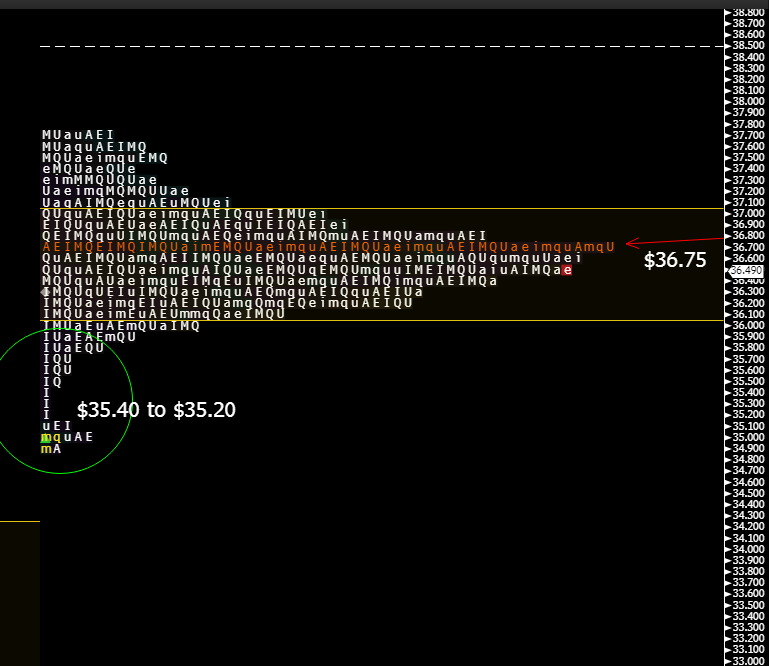
The dominant POC is $36.75, and it appears the roll is going to take it there. As of this morning, there were 39,700 lots of July open interest with 3 days to be out. Monday is July 1.
Just in case something happens, the single print void from $35.40 down to $35.20 is a strong area of support.
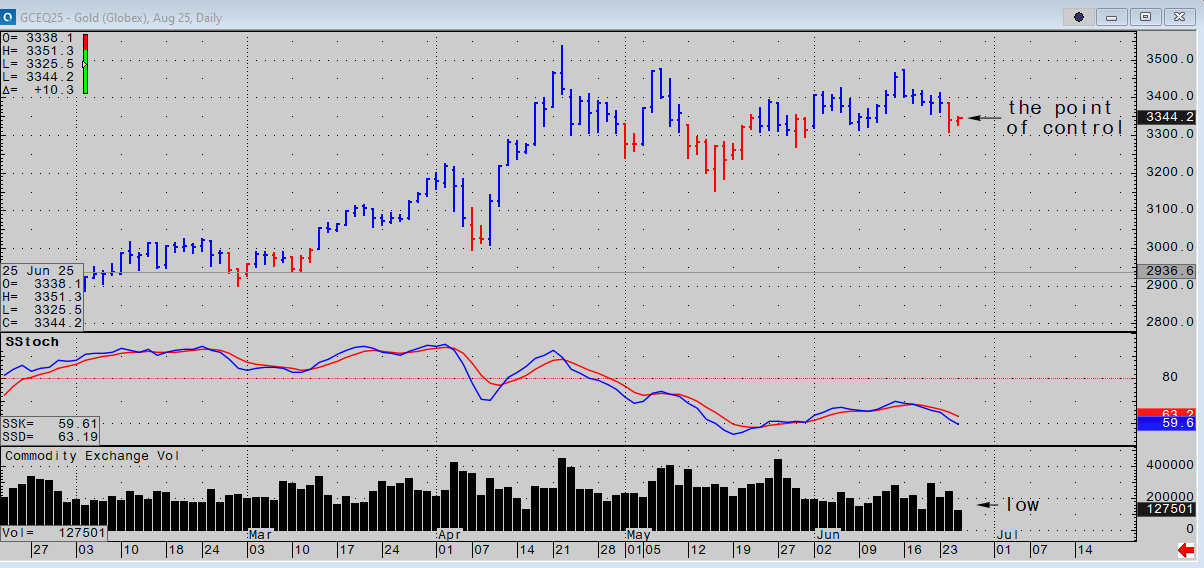
August gold opened on the POC at $3345.00, dipped to $3325.00, and returned to the POC and settled at the POC. They don’t call it the point of control for nothing.
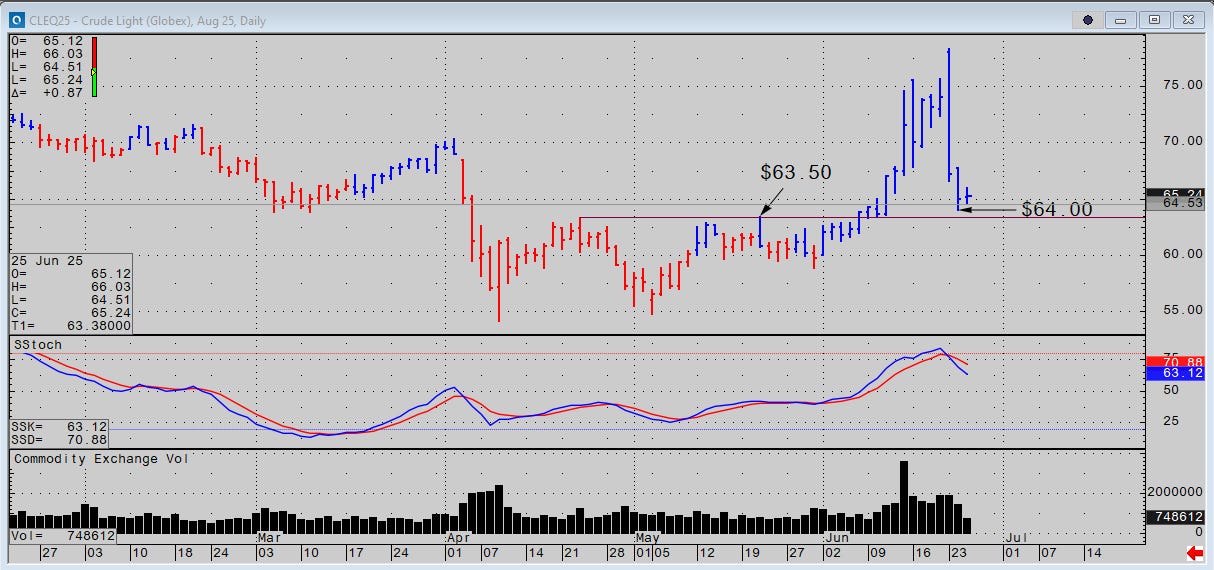
August WTI had a slow day. Volume was the lowest since mid-March. Prices hover above the April/May highs noted on the chart below. I’d say a close under $63.50 basis August would be a resumption of trends in May and negative for prices in July.
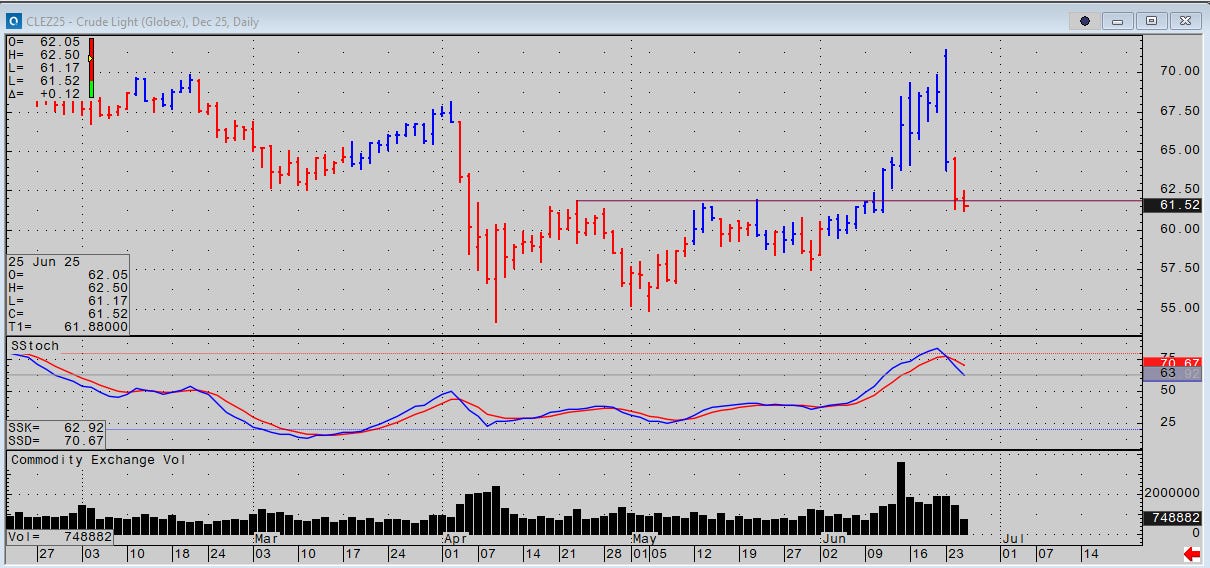
Reflecting weakness in the forward dates, December is already settling a few ticks below its April/May highs
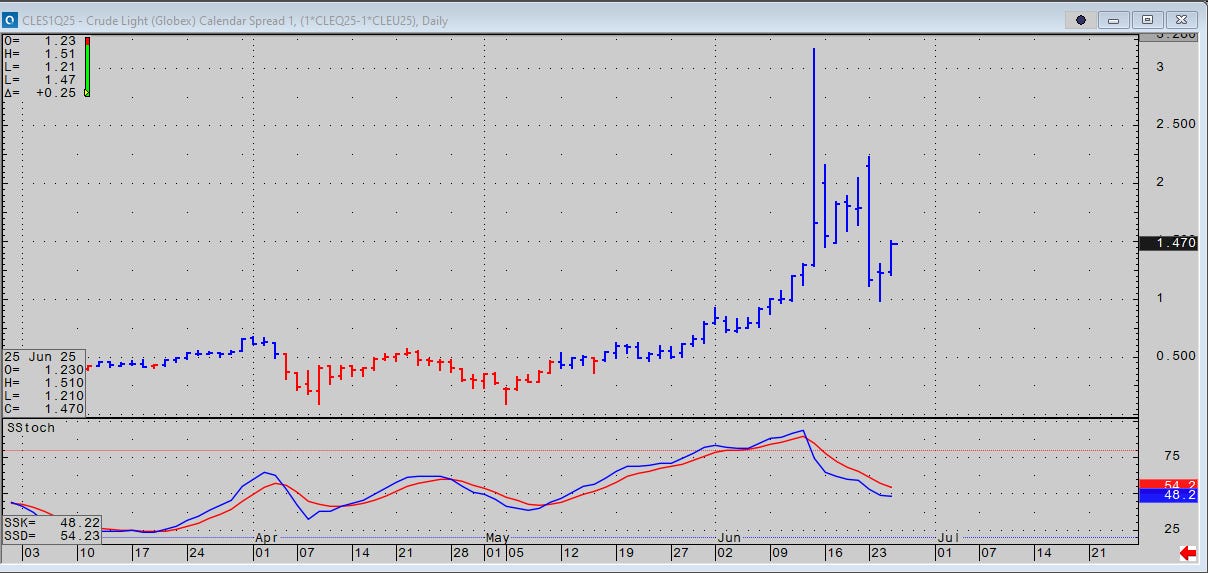
The one-month front spread rallied $0.26, indicating refinery demand. Dec Red Dec rallied less than $0.03 a month.
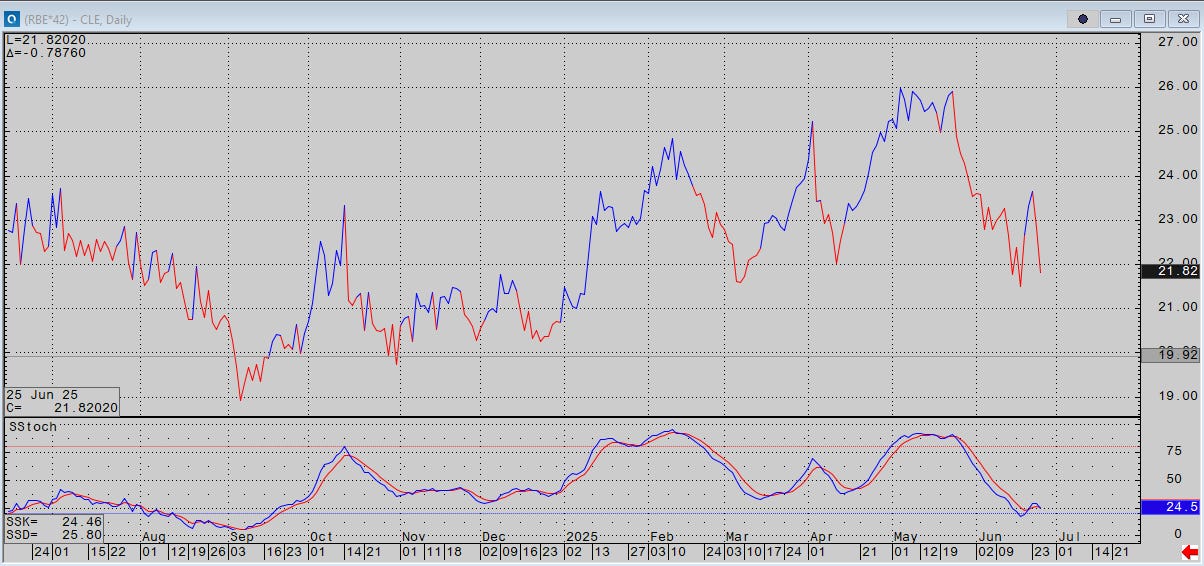
RBOB cracks took a hit today. The industry in America is steady and healthy except for refinery margins because crude prices are too high relative to product demand because there’s too much crude… same story before the war.
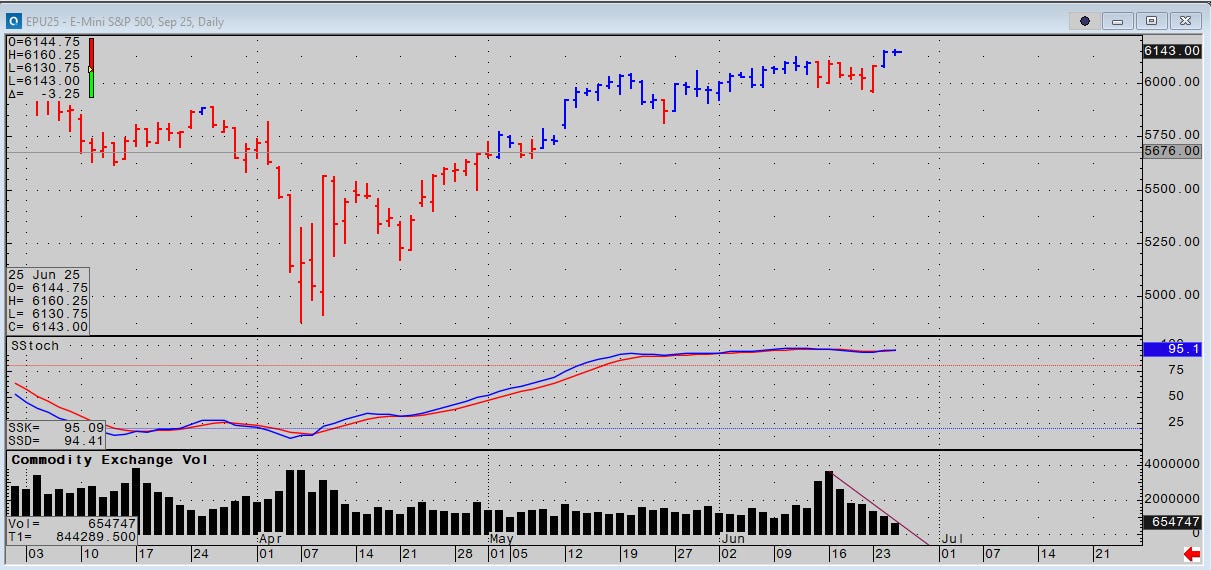
S&P futures might have traded the smallest range ever today. But Nvidia rallied 6% because some people who own it said bullish things about it. Seriously. Volume was too low to have any technical meaning. The dot on the chart is actually a full day’s range.
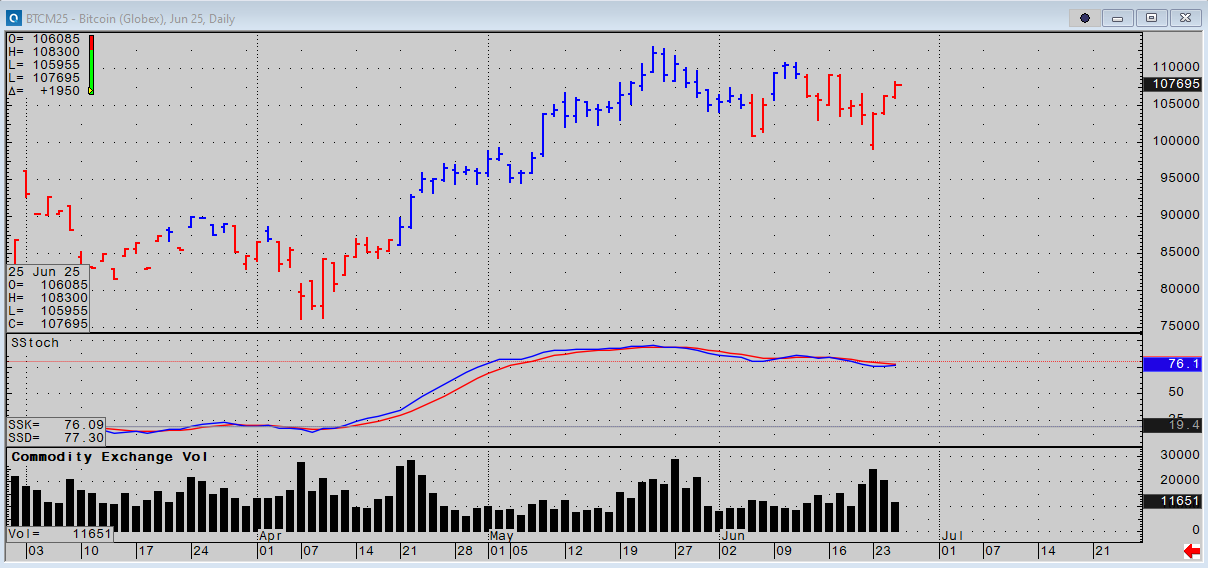
Bitcoin closed where it opened just like stocks. The chart looks better than the day’s activity.
my vibe
Oil is justifiably hesitant to go down, and no speculator is crazy enough to buy it. The direction from here will be organic. If more oil is produced as per OPEC and Iran’s new freedom to sell oil at will, we’ll see it in stats. If demand weakens, we’ll see it at the gas pumps. If the economy slows, it’ll show up in regular data. CTAs must have terrible performance in oil this month; another black eye for OPEC’s hopes of luring AUM back after the catastrophic NYMEX 2020 negative pricing affair. After 20 years of a static nominal gasoline price it’s probably the worst investment in history.
There is a lot of money around. Trump was ticking it off on his fingers at the presser today, noting the value of Iran as a trading partner and factories under construction in the States: $15 trillion USD. That’s an awful lot of materials and wages. Europe is going to spend a trillion a year on defense. That’s an awful lot of materials, metals, and wages.
Rates cuts and run hot coming…
Night all… good luck in Asia
JJ
If you like reading market vibes please hit the like button, and type in your e mail below to become a subscriber.
Share selectively with friends and colleagues and follow me on X @Alyosha745
Charts and data CQG and Bloomberg
Market vibes is not a registered investment advisor, and comments are for informational use only. Any mention of a particular security, index, derivative, or other instrument is NOT a recommendation to buy, sell, or hold that security, index, derivative, or any other instrument. Market vibes makes no representations as to the accuracy of data or any attributions.

excellent stuff JJ. I made some money fading the iran conflict in oil. Always appreciate your insights.
NVDA 3.77T market cap...