
evening wrap
market vibes

January 15… )
“There is no such uncertainty as a sure thing.” Robert Burns ca 1790.
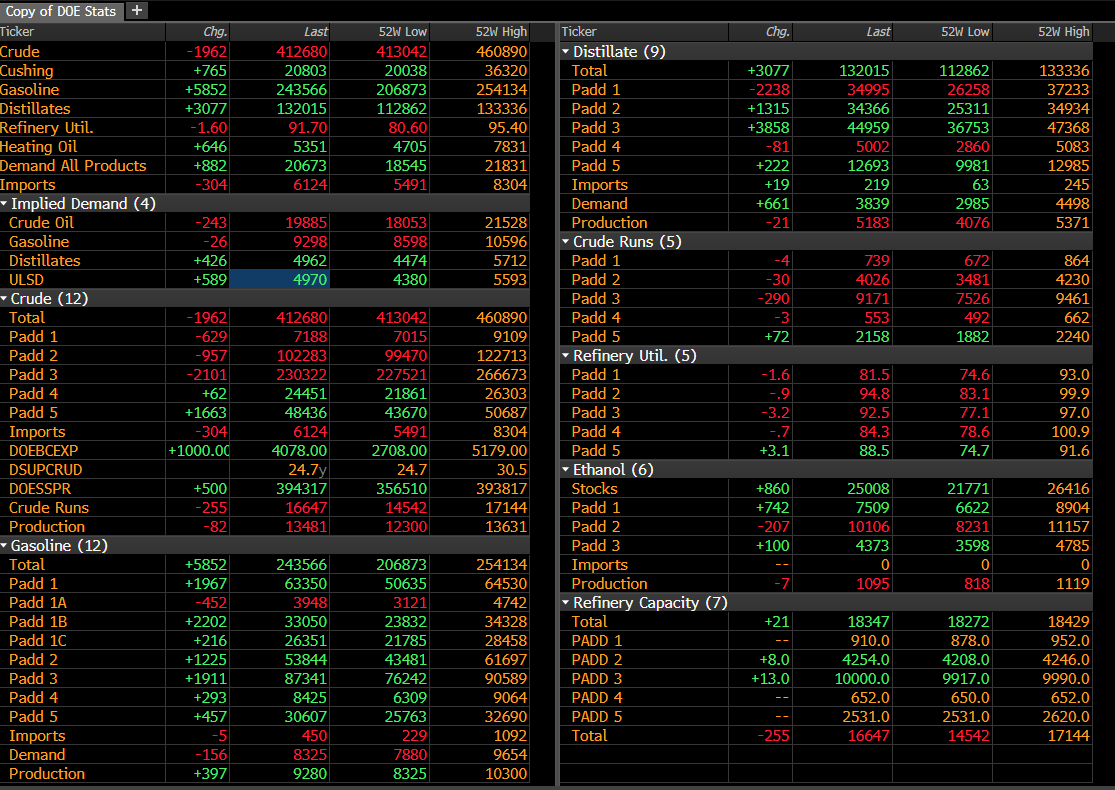
Probably the best illustration of the oil markets right now is the latest DOE survey of inventories and demand, released at 10:30 EST today. Total petroleum fluids in storage rose 6.967 million barrels. Last week they rose even more. From memeory, inventories of all fluids rose rough 16 million barrels in the last 2 weeks. Crude inventories fell ca 3.5 mm barrels in the same period.
*Note:
Yellen announced Russian sanctions on January 6, and Biden announced the drilling ban on January 6, so those actions were in the market four days before the survey of industry metrics and storage was completed.
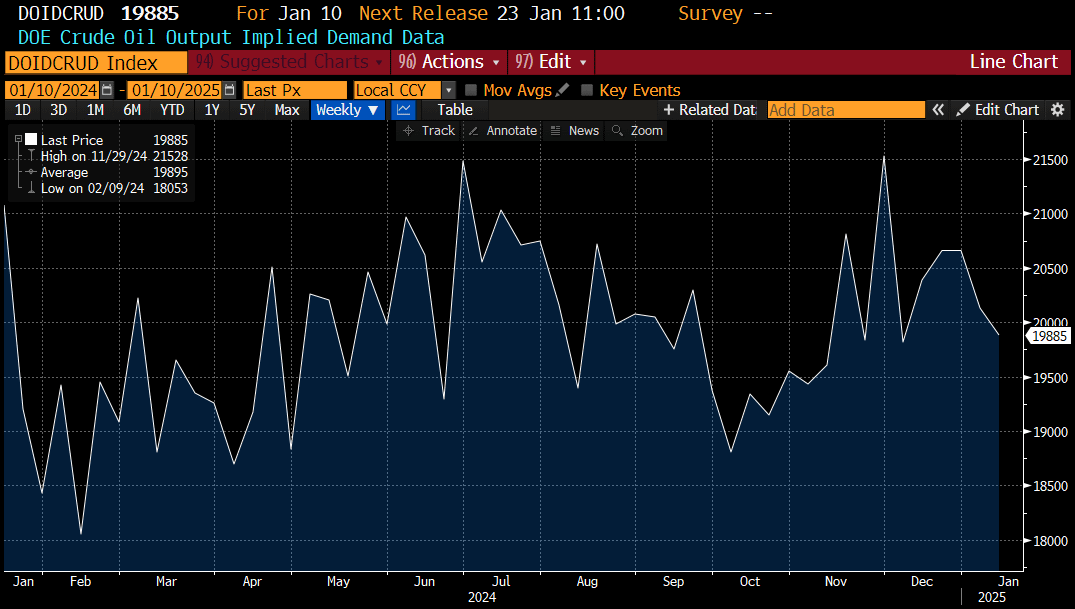
Implied Demand for Crude Oil = Domestic Consumption of Refined Products + Exports of Refined Products − Change in Inventories. … Inventories of products are rising faster than we are producing them. Let that sink in…Implied demand for crude fell 243k barrels per day in the last reporting period ending January 10.
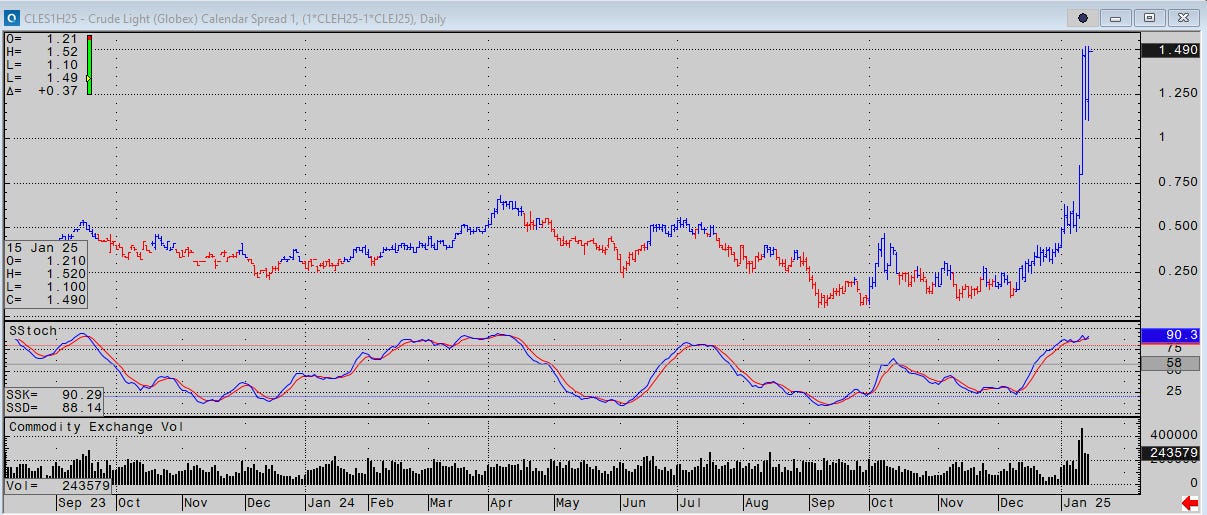
Even so, March-April WTI made new highs today and closed on contract highs.
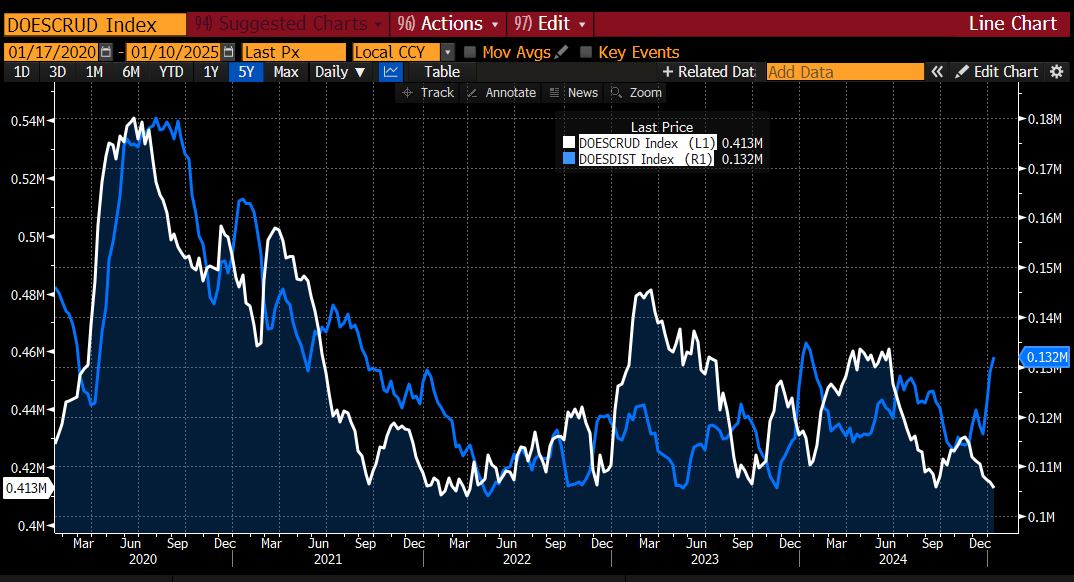
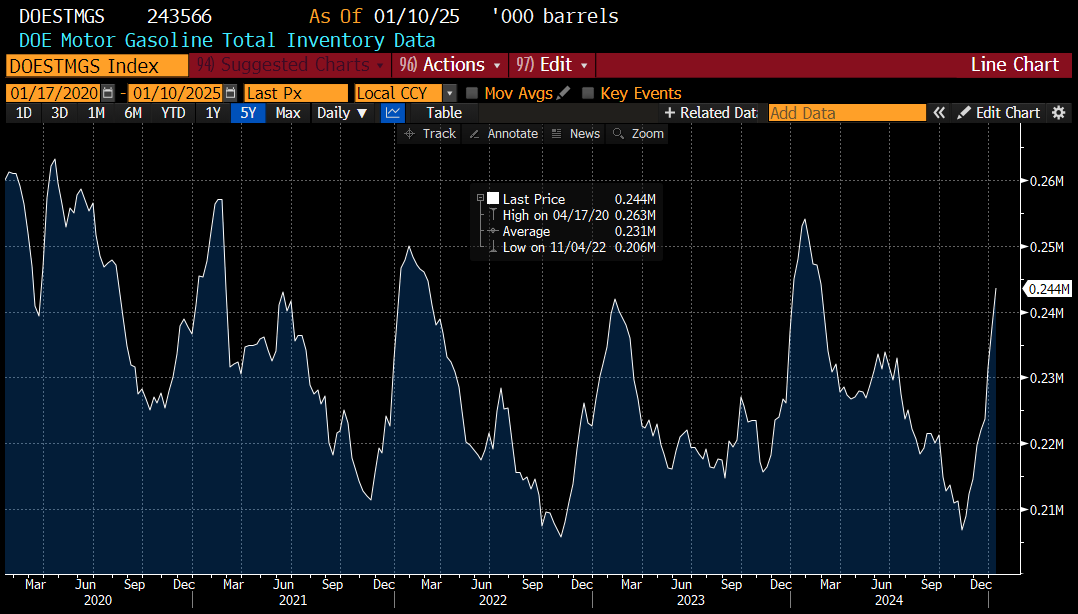
This is a perfect graphic example of what happens when crude prices are too high before the U.S. government initiates a squeeze: Crude inventories do go lower (because they are being manipulated) , but inventories of the stuff we use, like fuel oil Chart below) and gasoline (next chart), go up.
Whatever is happening in crude oil, there is no shortage of petroleum. Imports, exports, production, and runs are normal.
Moving right along… natural gas (heating up), S&Ps (unimpressive), and a short but deep dive under the surface of gold… where there has been furious paddling beneath calm waters.
