
evening wrap
market vibes

“I like to have a martini,
Two at the very most.
After three I'm under the table,
after four I'm under my host.” Dorothy Parker
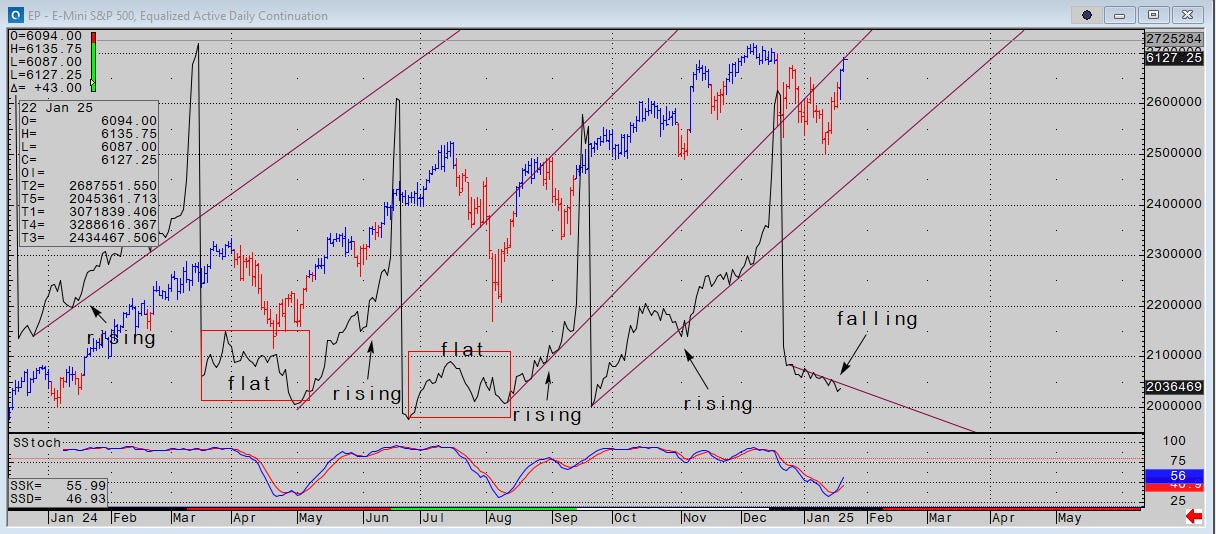
This is a chart of the S&P in CQG continuous daily data circa 3 PM EST, 1/22. The trend lines highlight consistently rising open interest in uptrends. That indicates new longs buying as the market goes up.
The red boxes indicate flat OI during periods when stocks go down. The time sample is 1 year. Falling OI indicates longs selling out to shorts covering.
I saw a piece of sell-side commentary today emphasizing 2 to 1 imbalance of in house short positioning and the steep recent decline in bullish sentiment to bearish. That fits with falling open interest since late December.
Technically, today’s trading in S&Ps was typically dull. 50% of the tick volume traded in the first 60 minutes, and the last 5 hours of the session were so lightly traded that hourly ranges were <= 10 handles until the final hour saw range extension lower on high volume.
I thought with Trump’s formal ascendancy on Monday, stocks would rally, and they did. But no one is getting in. Both sides are getting out, at least in futures. This is exchange data, not opinion.
In other markets,
