
2+2 = 3.99
market vibes

July 24…)

in the news
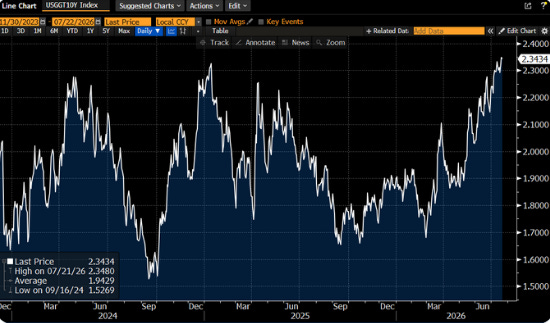
FOMC un-messaging implies hikes may be needed and pundits opine a 36% chance of a hike next Wednesday. The ECB is more likely to hike than hold, Simkus says via BBG. Meanwhile, 10 year Treasury real yields are the highest since 2008, according to Lisa Abramowicz on X (chart below)… real 30 year Treasury yields are 3%.
BBG writes this morning: “One casualty is BlackRock Inc.’s iShares 20+ Year Treasury Bond ETF, widely-used by investors to access the performance of longer maturity US government debt. The exchange-traded fund has fallen almost 5% over the past month, and has now lost more than half its value since 2020.” TLT has one of the largest ETF short positions on the board at circa 20% short interest.
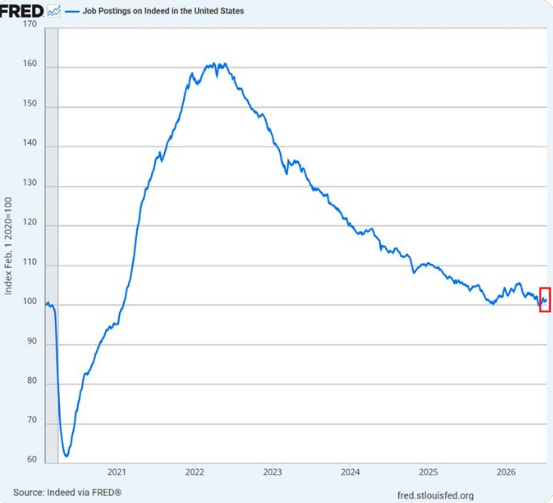
In recession news, US job postings on Indeed fell -3.5% YoY in the week ending July 10th, to near the lowest this year, according to the St. Louis Fed via Kobeissi. The FOMC announced the 1st post pandemic rate hike on March 16, 2022 and job postings are down -37.2% since April 2022. [“Furthermore, new job postings] on Indeed dropped -10.9% YoY, to the lowest since early January, continuing their over 4-year decline.”
Why would the FOMC even say they are planning to hike when real yields are already at GFC levels and jobs by any measure are scarce, especially good ones?
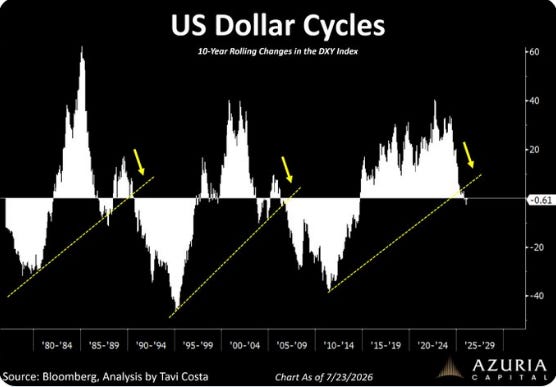
Otavio Costa says, “The US dollar’s inability to rally despite the surge in yields tells you everything you need to know about the current macro setup.”
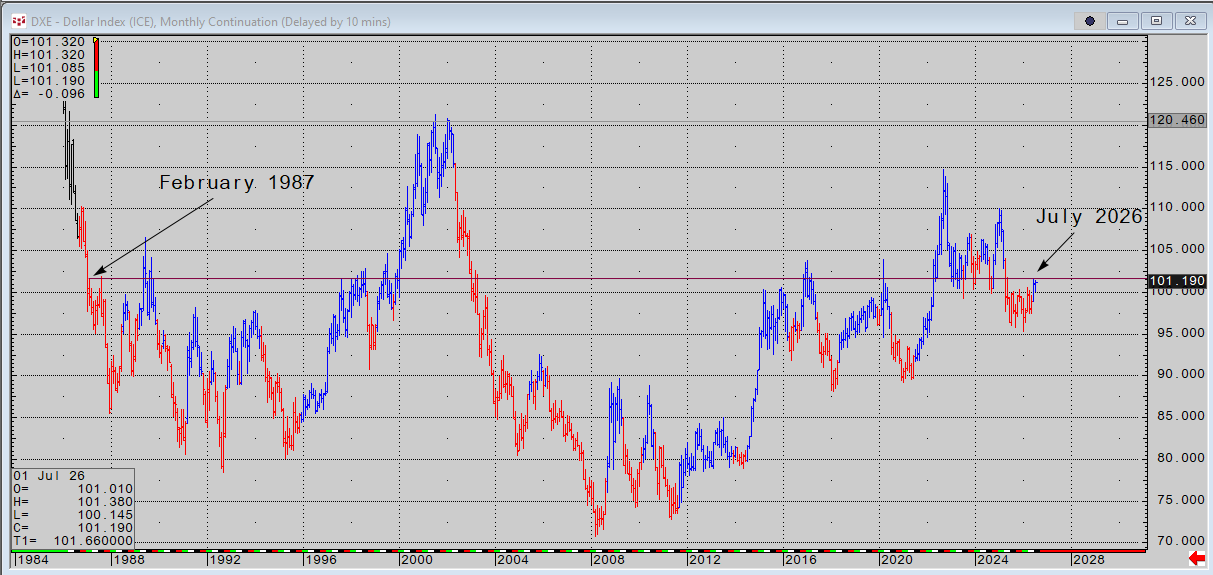
In other words… the dollar index hasn’t diverged from its anchored measure of 100 in 40 years. All fiat money is declining in purchasing power at roughly the same rate with temporary discounts and premiums.
In the stock market, the Mags lost $767 billion yesterday.
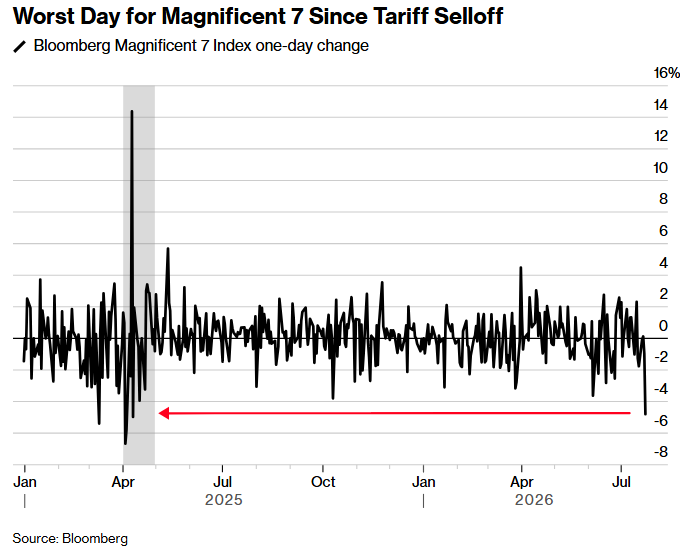
in the markets
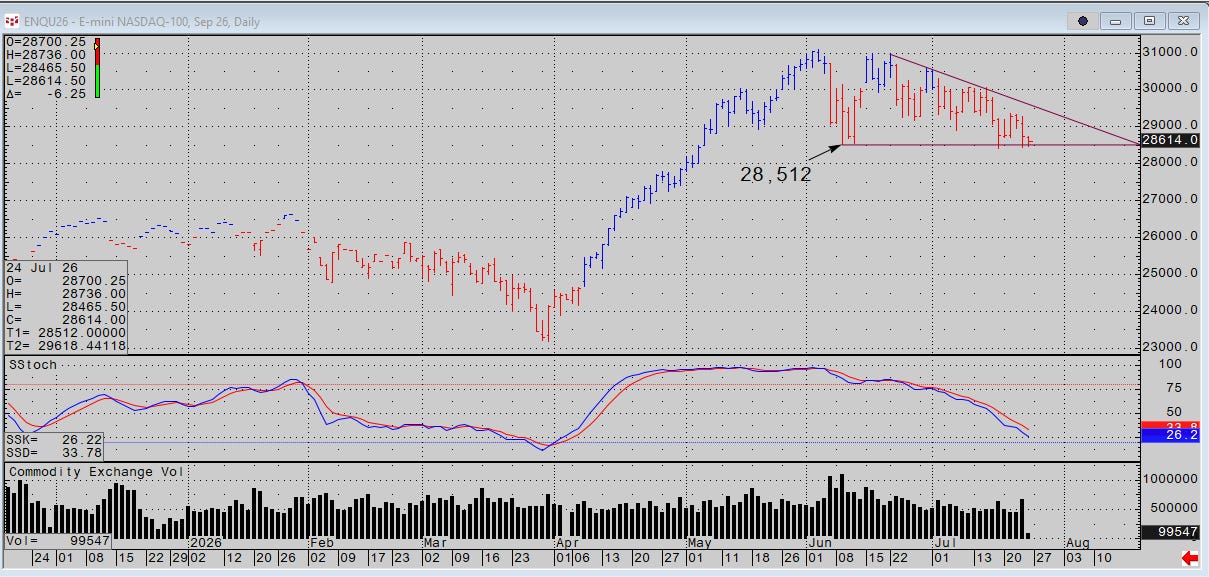
There is not a lot of bounce in NDX futures overnight. The declining wedge dominates the technical picture. These red bars are 10 period moving average DMI (directional movement index) readings that tell us the market is making more new lows than new highs in magnitude and frequency. That is a simplification but a good snapshot of how DMI works.
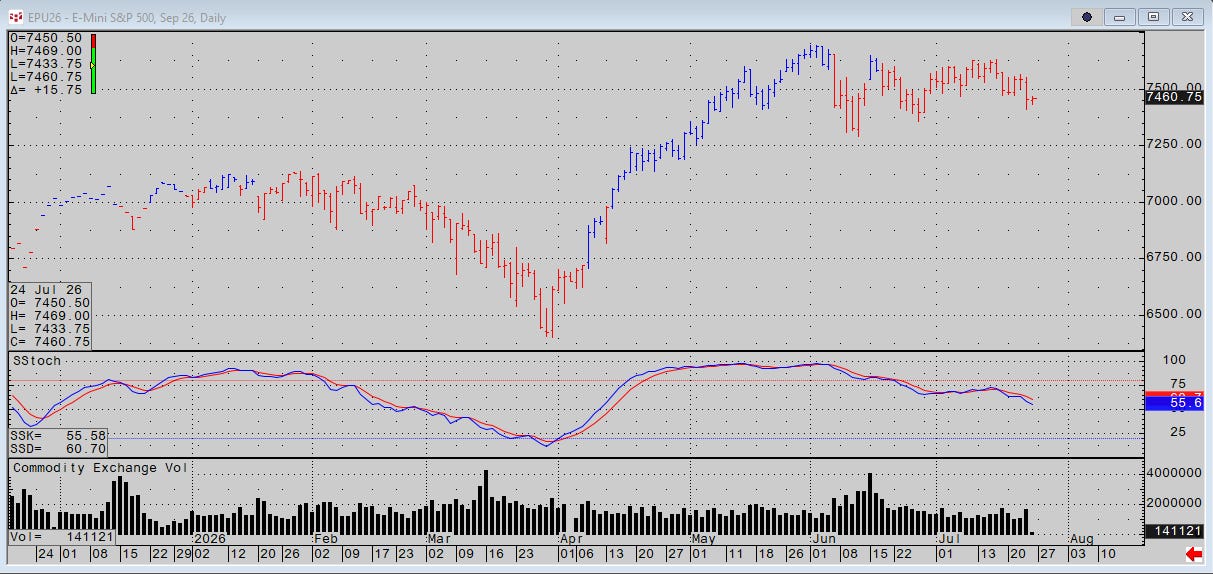
S&Ps are holding up better indicating the volumes are mostly defensive rotations.
The vertical rally in WTI is taking a breath.
